概述
ASP.NET Thread Pool 的機制如何影響 Redis
案例
線上維護的系統偶爾會發生 Redis Timeout Exception ,
並在 elmah 發現以下的錯誤記錄
1 | Timeout performing SETEX Cache:Prod:WebAPI:Key:20161121152607, inst: 18, mgr: ExecuteSelect, err: never, |
解析
這時當 StackExchange.Redis 在進行同步作業的時候,
如果超過 syncTimeout 的設定值(預設是 1000ms),
Redis 會佔用.NET 的 worker Thread
而在 .NET 底層隱含著一個機制,
會導致錯誤。
Thread Pool 500ms 的機制
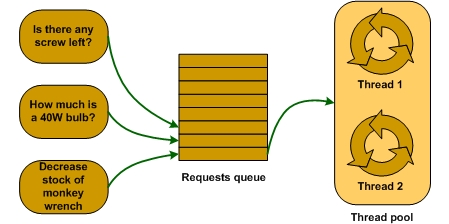
一種簡化的說法「 ASP.NET Thread Pool 一秒能建立 2 個 Thread。」
設定值 minworkerthread 就像是遊樂場已經開啟的閘門,
每當有一個遊客(Task)進來時,立即提供給它使用。
但是當遊客(Task)變多的時候,就會開始排隊(Queue),
ASP.NET Thread Pool 隱含著一個機制,
當它的隊伍(Queue)長達 500 豪秒沒有移動的話,
就會開啟新的閘門(建立新的 Thread)。
而我的情境屬於Burst of traffic,
突然大量 Task 湧入 Queue ,
ThreadPool 需要大量的 Thread
每個新的 Thread 都需要 500ms 的反應時間 ,
而累積的時間超過 Task 的 Timeout 設定值時 ,
就會拋出 Exception.
ASP.NET Thread Pool 的排隊機制與minworkerthread 設定值相關。
可以透過調整 machine.config 來修正。
參考(爭用、 效能不佳、 和死結 (deadlock) 當您從 ASP.NET 應用程式呼叫 Web 服務)。
minworkerthread 的預設值是 1 。
但是會與執行環境的 CPU 個數有關,
假設你是四核的主機,那就要乘上 4。
1 | <system.web> |
範例
當 Redis 發生 Timeout 時,
可以透過錯誤訊息判斷其背後的原因是否與 workerthread 有關。
在以下的例子可以看到 IOCP 與 WORKER 兩個值。
這兩值表示 .Net ThreadPool 內的兩種執行緒,
如果 Busy 值很高, 就有可能是 ThreadPool 來不及建立造成的錯誤。
1 | System.TimeoutException: Timeout performing MGET 2728cc84-58ae-406b-8ec8-3f962419f641, |
Error Code 說明
| Error code | Details | 範例 | 說明 |
|---|---|---|---|
| inst | in the last time slice: 0 commands have been issued | 在最後時脈:已發出 0 個命令 | 最後的時脈發出的命令個數 |
| mgr | the socket manager is performing “socket.select”, which means it is asking the OS to indicate a socket that has something to do; basically: the reader is not actively reading from the network because it doesn’t think there is anything to do |
最後的操作命令 | |
| queue | there are 73 total in-progress operations | 73 個正在排隊中的操作 | 正在排隊中的操作 |
| qu | 6 of those are in unsent queue: they have not yet been written to the outbound network | 6 個未發送的 queue | 未發送的 queue |
| qs | 67 of those have been sent to the server but a response is not yet available. The response could be: Not yet sent by the server sent by the server but not yet processed by the client. | 67 個已發送的 queue | 已發送的 queue |
| qc | 0 of those have seen replies but have not yet been marked as complete due to waiting on the completion loop | 0 個已發送未標記完成的 queue | 已發送未標記完成的 queue |
| wr | there is an active writer (meaning - those 6 unsent are not being ignored) bytes/activewriters | 有 1 個啟用的 writer,(意味著 qu 的工作並沒有被忽略) bytes/activewriters | bytes/activewriters |
| in | there are no active readers and zero bytes are available to be read on the NIC bytes/activereaders | 0 個 reader | bytes/activereaders |
參考
- Threading
- Improving ASP.NET Performance
- Programming the Thread Pool in the .NET Framework
- DiagnoseRedisErrors-ClientSide
- ThreadPool
其它的 Redis Error 情境
只作摘要式的翻譯。
Memory pressure (記憶體壓力)
Problem:
記憶體不足而開始讀取虛擬記憶體(磁碟)而導致特能低落。
Memory pressure on the client machine leads to all kinds of performance problems that can
delay processing of data that was sent by the Redis instance without any delay.
When memory pressure hits, the system typically has to page data from physical memory to
virtual memory which is on disk. This page faulting causes the system to slow down significantly.
Measurement:
Monitory memory usage on machine to make sure that it does not exceed available memory.
Monitor the Page Faults/Sec perf counter. Most systems will have some page faults even during
normal operation, so watch for spikes in this page faults perf counter which correspond with timeouts.
Resolution:
增加記憶體或是減少記憶體使用量
Upgrade to a larger client VM size with more memory or dig into your memory usage patterns
to reduce memory consuption.
Burst of traffic
Problem:
ThreadPool 突然大量的工作湧入 queue 導致執行緒來不及建立。
Bursts of traffic combined with poor ThreadPool settings can result in delays in processing
data already sent by the Redis Server but not yet consumed on the client side.
測量:
可以用程式監控 ThreadPool .
或是單純透過 TimeoutException 的訊息,觀察 IOCP 與 WORKER 的 Busy 值來判斷.
Measurement:
Monitor how your ThreadPool statistics change over time using code like this.
You can also look at the TimeoutException message from StackExchange.Redis.
Here is an example :
1 | System.TimeoutException: Timeout performing EVAL, inst: 8, mgr: Inactive, queue: 0, qu: 0, qs: 0, qc: 0, wr: 0, wq: 0, in: 64221, ar: 0, |
In the above message, there are several issues that are interesting:
Notice that in the “IOCP” section and the “WORKER” section you have a “Busy” value that is
greater than the “Min” value. This means that your threadpool settings need adjusting.
You can also see “in: 64221”. This indicates that 64211 bytes have been received at the kernel
socket layer but haven’t yet been read by the application (e.g. StackExchange.Redis).
This typically means that your application isn’t reading data from the network as quickly as
the server is sending it to you.
Resolution:
調整 ThreadPool 設定
Configure your ThreadPool Settings to make sure that your threadpool will scale up quickly under burst scenarios.
High CPU usage (CPU 過載)
Problem:
High CPU usage on the client is an indication that the system cannot keep up with the work that it has been asked to perform. High CPU is a problem because the CPU is busy and it can’t keep up with the work the application is asking it to do. The response from Redis can come very quickly, but because the CPU isn’t keeping up with the workload, the response sits in the socket’s kernel buffer waiting to be processed. If the delay is long enough, a timeout occurs in spite of the requested data having already arrived from the server.
Measurement:
Monitor the System Wide CPU usage through the azure portal or through the associated perf counter.
Be careful not to monitor process CPU because a single process can have low CPU usage at the same time that overall system CPU can be high.
Watch for spikes in CPU usage that correspond with timeouts. As a result of high CPU,
you may also see high “in: XXX” values in TimeoutException error messages as described above in the “Burst of traffic” section.
Note that in newer builds of StackExchange.Redis, the client-side CPU will be printed out in the timeout error message as long as the environment doesn’t block access to the CPU perf counter.
Note:
StackExchange.Redis version 1.1.603 or later now prints out “local-cpu” usage when a timeout occurs to help understand when client-side CPU usage may be affecting performance.
Resolution:
增加 CPU 或是找出 CPU 產生過載的原因
Upgrade to a larger VM size with more CPU capacity or investigate what is causing CPU spikes.
Client Side Bandwidth Exceeded (頻寬不足)
Problem:
Different sized client machines have limitations on how much network bandwidth they have available.
If the client exceeds the available bandwidth, then data will not be processed on the client side as quickly as the server is sending it. This can lead to timeouts.
Measurement:
Monitor how your Bandwidth usage change over time using code like this. Note that this code may not run successfully in some environments with restricted permissions (like Azure WebSites).
Resolution:
加大頻寬或減少使用量
Increase Client VM size or reduce network bandwidth consumption.
Large Request/Response Size (過大的請求/回應量)
Problem:
如圖所示,A 與 B 兩個 Request 都太過龐大,當同時發動請求時,
A 回應的時間過長, 導致 B 的 Timeout
A large request/response can cause timeouts. As an example, suppose your timeout value configured is 1 second.
Your application requests two keys (e.g. ‘A’ and ‘B’) at the same time using the same physical network connection.
Most clients support “Pipelining” of requests, such that both requests ‘A’ and ‘B’ are sent on the wire to the server one after the other without waiting for the responses.
The server will send the responses back in the same order. If response ‘A’ is large enough it can eat up most of the timeout for subsequent requests.
Below, I will try to demonstrate this. In this scenario, Request ‘A’ and ‘B’ are sent quickly,
the server starts sending responses ‘A’ and ‘B’ quickly, but because of data transfer times,
‘B’ get stuck behind the other request and times out even though the server responded quickly.
1 | |-------- 1 Second Timeout (A)----------| |
Measurement:
This is a difficult one to measure. You basically have to instrument your client code to track large requests and responses.
Resolution:
將所需要的資料分割成數個小片段 再分別取回
Redis is optimized for a large number of small values, rather than a few large values.
The preferred solution is to break up your data into related smaller values. See here for details around why smaller values are recommended.
Increase the size of your VM (for client and Redis Cache Server), to get higher bandwidth capabilities,
reducing data transfer times for larger responses.
Note that getting more bandwidth on just the server or just on the client may not be enough.
Measure your bandwidth usage and compare it to the capabilities of the size of VM you currently have.
Increase the number of ConnectionMultiplexer objects you use and round-robin requests over different connections (e.g. use a connection pool).
If you go this route,make sure that you don’t create a brand new ConnectionMultiplexer for each request as the overhead of creating the new connection will kill your performance.
(fin)